하루에 10분씩 공부하는 AP Statistics - #38 카이제곱분포(Chi-square Distribution)
다음과 같은 통계실험을 생각해보자.표준편차가 σ인 정규모집단(normal population)에서 크기가 n 인 임의표본(random sample)을 선택하였다. 표본의 표준편차는 s라면, 주어진 자료에서 다음 식을 이용해 카이제곱(chi-square)이라는 통계량을 계산할 수 있다.
Χ2 = [ ( n - 1 ) * s2 ] / σ2
만일 이 실험을 수 없이 반복한다면, 카이제곱 통계량을 위한 표집분포를 얻을 수 있다. 카이제곱분포(chi-square distribution)는 다음 확률밀도함수(probability density function)로 정의된다.
Y = Y0 * ( Χ2 ) ( v/2 - 1 ) * e-Χ2 / 2
여기서 Y0 는 자유도에 따라 결정되는 상수, Χ2 는 카이제곱 통계량, v = n - 1 은 자유도, e 는 자연상수(약 2.71828)이다. Y0 는 카이제곱곡선 아래 넓이가 1이 되도록 정한다.

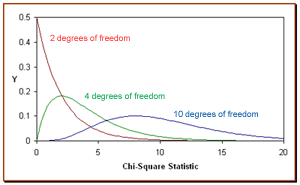
위의 그림에서 빨간선은 표본의 크기가 3인 경우, 즉 자유도가 n-1=3-1=2 일 때의 카이제곱분포이다. 녹색선은 표본의 크기가 5 즉, 자유도가 4일 때의 카이제곱분포, 파란선은 표본의 크기가 11 즉, 자유도가 10일 때의 카이제곱분포를 나타낸 것이다.
카이제곱분포는 다음 성질을 갖는다.
- 분포의 평균은 자유도와 같다. 즉, μ = v
- 분산은 자유도의 2배이다. 즉, σ2 = 2 * v
- 자유도가 2보다 크거나 같은 경우 Y의 최대값은 Χ2 = v - 2 일 때이다.
- 자유도가 커질수록 카이제곱분포는 정규분포에 가까워진다.
▶ 카이제곱분포의 누적확률(Cumulative Probability and the Chi-Square Distribution)
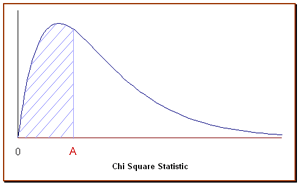
카이제곱분포는 곡선아래 넓이가 1이 되도록 정한다. 0 부터 특정 카이제곱 통계량 까지의 곡선 아래 넓이는 특정 카이제곱 통계량의 누적확률이다. 즉, 다음 그림에서 빗금친 부분은 카이제곱 통계량이 A일 때의 누적확률을 나타낸다.

확인하고 넘어가기
Problem1
The Acme Battery Company has developed a new cell phone battery. On average, the battery lasts 60 minutes on a single charge. The standard deviation is 4 minutes.
Suppose the manufacturing department runs a quality control test. They randomly select 7 batteries. The standard deviation of the selected batteries is 6 minutes. What would be the chi-square statistic represented by this test?
Problem 2
Let's revisit the problem presented above. The manufacturing department ran a quality control test, using 7 randomly selected batteries. In their test, the standard deviation was 6 minutes, which equated to a chi-square statistic of 13.5.
Suppose they repeated the test with a new random sample of 7 batteries. What is the probability that the standard deviation in the new test would be greater than 6 minutes?